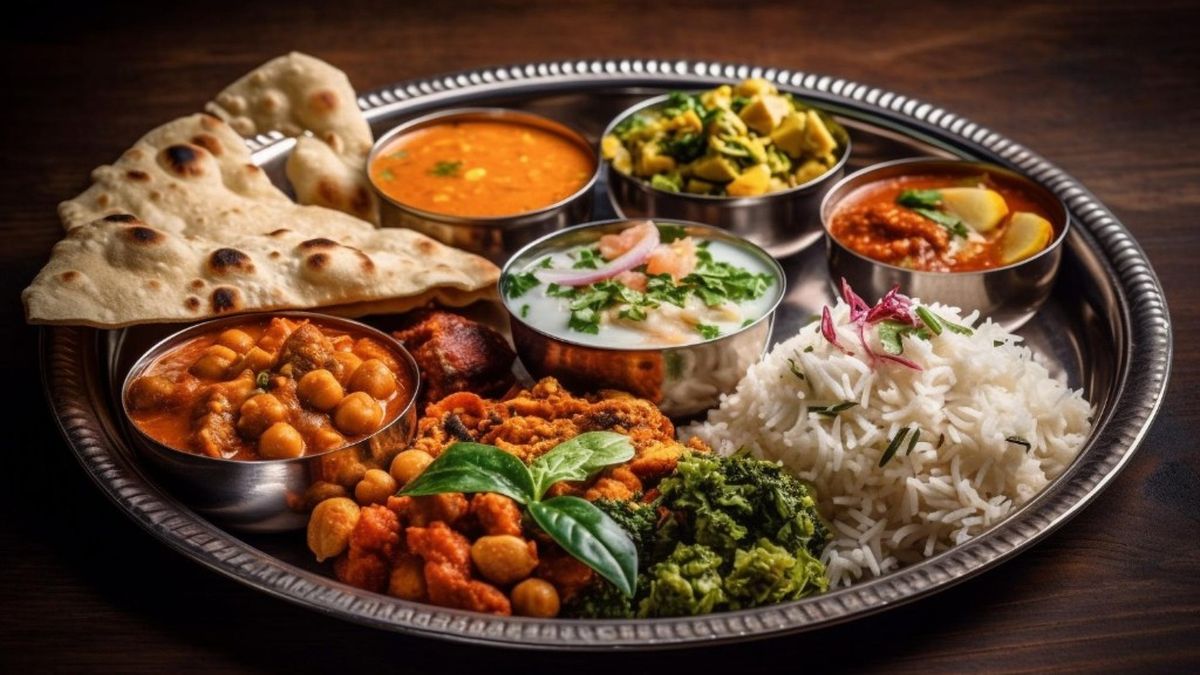
The glycemic index (GI, also spelt glycaemic index) of Indian foods is quoted everywhere, often as a single number with no source.
For what diabetes is and how it is diagnosed and treated, read our diabetes guide covering symptoms, tests and treatment.
If you take insulin or sugar-lowering tablets, agree any change in what or how much you eat with your doctor first, because eating less carbohydrate than usual can push sugar too low.
What glycaemic index and glycaemic load mean
GI ranks carbohydrate foods by how fast and how high they raise blood sugar, compared with pure glucose. Diabetes UK describes it as a ranking from 0 to 100 of how quickly each carbohydrate food makes blood sugar rise.
The test is always done the same way. Healthy volunteers eat a portion of the food containing 50 g of available carbohydrate after an overnight fast, and their blood sugar is checked over two hours. On other days they drink 50 g of glucose. The food's GI is its blood-sugar rise as a percentage of the glucose rise, averaged across the group. Most values below come from groups of 10 to 19 people.
- Low GI: 55 or below
- Medium GI: 56 to 69
- High GI: 70 or more
Glycaemic load (GL) adds the portion. It is the GI multiplied by the grams of available carbohydrate in the serving, divided by 100. As an illustration only: a food with a GI of 73 eaten in a portion with 25 g of carbohydrate has a GL of about 18. Eat twice that portion and the GL doubles to about 37, while the GI stays 73.
Glycemic index of Indian foods: published values
Every value below comes from a named study, with the test conditions in the last column. Where two studies disagree, both are shown. Treat each figure as one lab's result for one recipe, not the exact number for the food in your kitchen. Indian Council of Medical Research–National Institute of Nutrition (ICMR-NIN)'s own table carries the same warning: its values "are only indicative" and "may differ depending on the ratios of different ingredients and preparation methods".
Rice, roti, millets and breakfast dishes
| Food | Published GI | Band | Source and how it was tested |
|---|---|---|---|
| White rice, boiled | 73 | High | International GI tables 2008: average of several studies |
| Rice (Indian study) | 78 | High | ICMR-NIN Dietary Guidelines 2024 table: mean of 10 participants |
| Sona Masuri, Ponni and Surti Kolam rice | 72, 70 and 77 | High | Madras Diabetes Research Foundation, 2012: healthy volunteers, Chennai; differences between varieties not significant |
| Brown rice, boiled | 68 | Medium | International GI tables 2008: average of several studies |
| Chapati / wheat roti | 52 and 62 | Low and medium | International GI tables 2008: two separate entries ("chapatti" and "wheat roti") |
| Wheat chapati | 62 and 66 | Medium | ICMR-NIN 2024 table: two entries from two studies, 10 participants each |
| Jowar (sorghum) roti | 84 | High | Chennai study, 2022: 12 to 15 healthy adults with body mass index (BMI) above 23 per food |
| Bajra (pearl millet) roti | 70 | High | Chennai study, 2022, as above |
| Makki (maize) roti | 75 | High | Chennai study, 2022, as above |
| Ragi mudde (finger millet stiff porridge) | 98 | High | Chennai study, 2022, as above |
| Methi paratha | 60 | Medium | Chennai study, 2022, as above |
| Broken wheat (dalia) upma | 52 | Low | Chennai study, 2022, as above |
| Barley | 28 | Low | International GI tables 2008 |
| Rolled oats porridge / instant oat porridge | 55 / 79 | Low / high | International GI tables 2008 |
| Idli with sambar | 69 | Medium | ICMR-NIN 2024 table: 10 healthy adults |
| Rice idli from a packaged premix | 85 | High | Singapore study, 2018: 19 healthy young men, idli eaten on its own |
| Plain dosa | 79 | High | ICMR-NIN 2024 |
| Wheat dosa | 62 | Medium | Chennai study, 2022 |
| Pesarattu (moong dosa) | 61 | Medium | ICMR-NIN 2024 |
| Rava upma from a packaged premix | 71 | High | Singapore study, 2018 |
| Curd rice / lemon rice | 65 / 79 | Medium / high | ICMR-NIN 2024 |
| Vada with sambar | 37 | Low | ICMR-NIN 2024 (a deep-fried food; see below) |
| Cornflakes | 81 | High | International GI tables 2008 |
We did not find a standard human GI test for home-made poha, sabudana or jaggery that we could trace, so they are left out rather than guessed.
Dals, beans and dairy
| Food | Published GI | Band | Source and how it was tested |
|---|---|---|---|
| Rajma (kidney beans) | 24 | Low | International GI tables 2008 |
| Kabuli chana (chickpeas) | 28 | Low | International GI tables 2008 |
| Chana sundal / white peas sundal | 24 / 30 | Low | Chennai study, 2022 |
| Lentils | 32 | Low | International GI tables 2008 |
| Bengal gram / masoor dal / moong / toor | 38 / 42 / 42 / 43 | Low | ICMR-NIN 2024 table: 10 participants each |
| Soya beans | 16 | Low | International GI tables 2008 |
| Milk, full fat / skimmed | 39 / 37 | Low | International GI tables 2008 |
| Fruit yoghurt | 41 | Low | International GI tables 2008 |
Vegetables, fruit and sugars
| Food | Published GI | Band | Source and how it was tested |
|---|---|---|---|
| Potato, boiled | 78 | High | International GI tables 2008 |
| Sweet potato (shakarkandi), boiled | 63 | Medium | International GI tables 2008 |
| Pumpkin (kaddu), boiled | 64 | Medium | International GI tables 2008 |
| Carrot, boiled | 39 | Low | International GI tables 2008 |
| Apple / orange | 36 / 43 | Low | International GI tables 2008 |
| Banana / mango | 51 / 51 | Low | International GI tables 2008 (ripeness changes this) |
| Pineapple | 59 | Medium | International GI tables 2008 |
| Watermelon | 76 | High | International GI tables 2008 (but little carbohydrate per slice) |
| Dates (khajoor) | 42 | Low | International GI tables 2008 |
| Table sugar / honey | 65 / 61 | Medium | International GI tables 2008 (both still added sugar) |
Why the same food gets different numbers
The same food can test low in one study and high in another because GI depends on the variety, the grinding, the recipe and the people tested. Diabetes UK lists cooking method, processing such as milling, and ripeness or variety as factors that can change GI significantly.
- Grinding and texture. The Chennai researchers concluded that "merely being a whole grain-based food does not qualify for a lower GI". Ragi flour cooked into a smooth mudde tested at 98, while coarse broken wheat in upma tested at 52. Finer flour and softer cooking mean faster digestion.
- Recipe. Idli with sambar tested at 69 at ICMR-NIN; a packaged rice-idli premix eaten on its own tested at 85 in Singapore. The Singapore authors linked the high value to the large share of rice flour and the low fat and protein.
- Variety. Three common Indian rice varieties all tested high (70 to 77), so switching between them makes little difference. Most rice and potato varieties are high GI, though the international tables note some lower-GI cultivars exist.
- The lab and the volunteers. Different studies use different people, portions and methods. The two chapati entries in the international tables (52 and 62) and the two in ICMR-NIN's table (62 and 66) show how much this matters.
What GI misses
GI describes one food, eaten alone, in a 50 g carbohydrate portion, averaged across a small group. Real meals differ on every one of those points.
Portion
The 50 g test portion is not what you eat. In the Chennai study, 50 g of carbohydrate meant about 114 g of jowar roti but about 225 g of chana sundal. A big plate of a "low GI" food can carry more glycaemic load than a small portion of a high one. Diabetes UK's own example: pasta has a lower GI than watermelon, but because it has more carbohydrate, the same amount of pasta raises blood sugar more.
Fat
Fat slows digestion, so fried food often tests lower. Vada with sambar had the lowest GI in ICMR-NIN's table (37), below chapati. Diabetes UK notes most chocolate is low GI for the same reason. A low number is not a health rating.
The rest of the meal
Diabetes UK says the GI value relates to a food eaten on its own, and that combining foods changes the GI of the meal. Protein, fat and fibre slow the absorption of carbohydrate. The Chennai authors suggest that pairing high-GI foods with low-GI legumes "may favourably modify" the meal's response; this is a reasonable inference, not a meal-tested result. Rice with thick dal and sabzi is a different meal from rice alone.
You
People respond differently, and the same person responds differently on different days. In a US study, 63 healthy adults ate the same white bread three times. The average GI was 62, yet the bread would have been classed low GI for 22 people, medium for 23 and high for 18. The authors concluded that a single food's GI "is unlikely to be a good approach to guiding food choices" for an individual.
Nutrition
GI says nothing about fibre, protein, salt or vitamins. Honey (61) and table sugar (65) both sit in the medium band, yet ICMR-NIN counts sucrose, jaggery and honey all as added sugars. Dates are low GI and still a concentrated sweet.
How to use GI sensibly
Use GI to choose between similar carbohydrate foods, after you have sorted out the portion. Guidelines broadly agree on that order, with different emphasis.
- Indian Council of Medical Research (ICMR) 2018 type 2 diabetes guideline: "Although different carbohydrates produce different glycemic responses, from clinical point of view it is important to manage total carbohydrate." It recommends high-fibre carbohydrates such as whole grains, legumes and "some fruits with low glycemic index and glycemic load".
- American Diabetes Association (ADA) Standards of Care 2026: studies show mixed effects of GI and GL on glycated haemoglobin (HbA1c), and "low GI or low GL is synonymous with higher-fiber eating patterns".
- Diabetes UK: choosing low-GI foods can help manage HbA1c in type 2 diabetes, but portion size has the bigger impact.
For Indian readers, we follow the ICMR order: portion first, then GI within that portion. This is our reading of the guidance, not a rule any single body states.
The evidence for the benefit is real but modest. A 2021 British Medical Journal (BMJ) review of randomised trials in 1,617 people with type 1 or type 2 diabetes found low-GI or low-GL diets lowered HbA1c by 0.31 percentage points over a median of 12 weeks, compared with higher-GI diets. Several authors declared links to GI-testing companies and food industry funders.
Practical takeaways:
- Measure the grain first. A katori of rice or two phulkas (our starting example, not a guideline figure) matters more than which rice or atta you buy.
- Pick the coarser, less processed form. Dalia over maida, whole dal over smooth batter, rolled oats over instant.
- Put dal, beans, dahi or eggs on the same plate. Whole pulses and dals tested low in every study above.
- Do not trade sugar for "low GI" sweets. Honey, gud and "diabetic" mithai are still sugar.
- Check your own response if your doctor has asked you to test. Readings around your usual meals tell you more than any table.
Our GI lookup tool gives one average per food as an educational estimate. Its figures will not always match the ones on this page, because published values differ. If you take insulin or sugar-lowering tablets, agree any change in carbohydrate portions with your doctor first.
When to see a doctor
Our diabetes guide has the full list of warning signs.
Emergency: get help now
- Someone with suspected low sugar is drowsy, confused, cannot swallow safely, has a fit or is unconscious.
- High readings with vomiting, abdominal pain, deep or fast breathing, marked drowsiness or confusion.
Prompt review: same day
- Low-sugar symptoms such as shaking, sweating or confusion, especially on insulin or sulfonylurea-type tablets. Treat as your care team has taught you, then call them.
- Repeated very high or low readings, or you cannot keep food and fluids down.
Routine review
- You want to make a big change in carbohydrate portions while on sugar-lowering medicine.
- You are pregnant or planning a pregnancy and have diabetes.
- Your readings after meals stay high even though you have changed your plate.
How Disha can help
Disha is an AI health coach that chats and calls in Hindi, English and Hinglish. After an onboarding call of about 15–20 minutes, conducted by Disha itself, it can help you apply portion and pairing ideas to your own regional meals and keep food, movement and sleep habits going. Disha does not diagnose, prescribe, change medicine doses or provide emergency care, and it does not replace your doctor or dietitian. Read how Disha coaching works.
This is not medical advice. This page is general information for adults. If you take insulin or sugar-lowering tablets, are pregnant or breastfeeding, have kidney disease or an eating-disorder history, agree any change with your doctor first. Do not start, stop or change a medicine based on this page. In an emergency, call 112.
Frequently asked questions
Which Indian foods have a low glycaemic index?
Pulses test lowest: rajma, chickpeas, lentils and dals such as masoor, moong and toor all scored below 45 in published studies. Milk, apples, oranges and barley are also low. Broken wheat upma scored 52 in one Chennai study. Portion still matters, and pairing a grain with dal lowers the effect of the whole meal.
Is brown rice much better than white rice for sugar?
A little. The international GI tables list boiled brown rice at 68 and white rice at 73, so brown rice is medium GI and white is high, but the gap is small. It adds fibre. The portion of rice and what you eat with it make a bigger difference than the colour of the grain.
Is roti better than rice for blood sugar?
Usually a little. Published values for chapati range from 52 to 66, while white rice ranges from about 70 to 78 in the studies on this page. Both are still carbohydrate foods, so two phulkas and a heaped plate of rice are not comparable. Keep either to a measured portion and eat it with dal and sabzi.
Are millets low GI?
Not automatically. In a 2022 Chennai study, jowar roti tested at 84, bajra roti at 70 and ragi mudde at 98, while a sorghum idli made with urad dal tested at 61. Reviews report lower averages for millets than for milled rice. How the millet is ground and cooked matters as much as the grain.
Does a low-GI diet lower HbA1c?
Modestly. A 2021 BMJ review of trials in adults with diabetes found low-GI or low-GL diets lowered HbA1c by 0.31 percentage points over about 12 weeks, compared with higher-GI diets. The ADA describes the research as mixed. A low-GI diet supports treatment; it does not replace medicine or portion control.
Is honey or jaggery lower GI than sugar?
Honey tested at 61 and table sugar at 65 in the international GI tables, both medium GI. We found no traceable standard test for jaggery. The small difference does not matter: ICMR-NIN counts sugar, jaggery and honey all as added sugars, and all of them raise blood glucose.
Why does my sugar rise more than the GI table suggests?
GI is an average from about 10 to 19 healthy people eating one food alone. Your portion, the rest of the meal, the time of day, sleep, illness, activity and your medicines all change your reading. One US study found the same bread tested low for some people and high for others. If readings stay high, discuss them with your doctor.
Sources
- Atkinson FS, Foster-Powell K, Brand-Miller JC. International Tables of Glycemic Index and Glycemic Load Values: 2008. Diabetes Care, 2008. Supports: average GI values for white and brown rice, chapatti and wheat roti, barley, oats, cornflakes, legumes, milk, yoghurt, potato, sweet potato, pumpkin, carrot, fruit, sugar and honey; the method for calculating glycaemic load; most rice and potato varieties being high GI.
- ICMR–National Institute of Nutrition. Dietary Guidelines for Indians. 2024. Supports: Annexure III table of GI for rice, chapati, dals and South Indian breakfast dishes (10 participants each, values "only indicative"); jaggery and honey counted as added sugars.
- Shobana S, Geetha G, Bai MR, et al. Carbohydrate profiling & glycaemic indices of selected traditional Indian foods. Indian Journal of Medical Research, 2022. Supports: GI of jowar, bajra and maize roti, ragi mudde, sorghum idli, wheat dosa, methi paratha, broken wheat upma and sundals; test method with 50 g available carbohydrate; cooked weights for 50 g carbohydrate; whole grain alone not guaranteeing low GI.
- Shobana S, Kokila A, Lakshmipriya N, et al. Glycaemic index of three Indian rice varieties. International Journal of Food Sciences and Nutrition, 2012. Supports: GI of Sona Masuri, Ponni and Surti Kolam rice, all high, with no significant difference between them.
- Tan WSK, Tan KWJ, Ponnalagu S, et al. The glycaemic index and insulinaemic index of commercially available breakfast and snack foods in an Asian population. British Journal of Nutrition, 2018. Supports: GI of rice idli, rice dosa and upma made from packaged premixes in 19 healthy men in Singapore; link between refined rice flour, low fat and protein, and high GI.
- Diabetes UK. Glycaemic index and diabetes. Reviewed 2025. Supports: the 0–100 scale and low, medium and high bands; cooking, processing and ripeness changing GI; combining foods changing a meal's GI; fat, protein and fibre lowering GI; portion having a bigger effect than GI; the pasta and watermelon example; low-GI choices helping HbA1c in type 2 diabetes.
- Indian Council of Medical Research. ICMR Guidelines for Management of Type 2 Diabetes. 2018. Supports: managing total carbohydrate being clinically more important than differences in glycaemic response; recommending high-fibre carbohydrates and some fruits with low GI and GL.
- American Diabetes Association Professional Practice Committee. 5. Facilitating Positive Health Behaviors and Well-being to Improve Health Outcomes: Standards of Care in Diabetes—2026. 2026. Supports: mixed evidence on GI and GL for HbA1c; low GI or low GL being synonymous with higher-fibre eating patterns.
- Matthan NR, Ausman LM, Meng H, et al. Estimating the reliability of glycemic index values and potential sources of methodological and biological variability. American Journal of Clinical Nutrition, 2016. Supports: white bread averaging GI 62 in 63 healthy adults but classing as low, medium or high for different people; single-food GI being a poor guide for individual choices.
- Chiavaroli L, Lee D, Ahmed A, et al. Effect of low glycaemic index or load dietary patterns on glycaemic control and cardiometabolic risk factors in diabetes: systematic review and meta-analysis of randomised controlled trials. BMJ, 2021. Supports: HbA1c 0.31 percentage points lower with low-GI or low-GL diets across 29 trial comparisons in 1,617 adults, median 12 weeks; authors' declared industry links.
Related reads
- Diabetes: symptoms, tests, treatment and Indian food: the overview of diagnosis, treatment and red flags that this page only summarises; its food section links here for food-by-food detail.
- Indian diabetes diet chart: veg and non-veg day plans: the plate, three day plans and a swap table, for turning these numbers into meals.
- Indian breakfasts for diabetes and cholesterol: where oats fit: breakfast choices in more depth, including rolled and instant oats.
- All diabetes articles: every Disha guide on diabetes in one place.
- Glycaemic index lookup for Indian foods: an educational estimate, not a personal glucose prediction.
- Calorie counter for Indian household servings: useful for comparing portions, with values treated as estimates.